GTD Explorer · D3.js
A globe, a Sankey diagram and an animated ranking to explore the Global Terrorism Database from 1970 to 2017.
Collaborative project · Information visualisation
One dataset.Three ways to read it.
Move from a world view to an individual event, connect categories and follow rankings over time. GTD Explorer brings these journeys together in an application where each representation answers a specific question.
Explore the globe, flows and rankings in the application (in French).
- incidents in the extract
- 181,691
- period covered, excluding 1993
- 1970–2017
- complementary views
- 3
Build a journey through the data.
The Global Terrorism Database describes incidents through dates, locations, associated groups, attack types, weapons, targets and known casualty figures. The extract used in this project covers 1970 to 2017 and contains 181,691 records.
The project addresses data journalists, students, researchers and analysts. Its framing connects their questions to concrete tasks: locate a concentration, compare periods, examine an association or retrieve an incident. The design report uses the What–Why–How framework to organise these decisions.
Where? How? Who?
Period, metric and country selection provide shared context. Readers can switch representations to explore their question further.
Where?
From the globe to an incident.
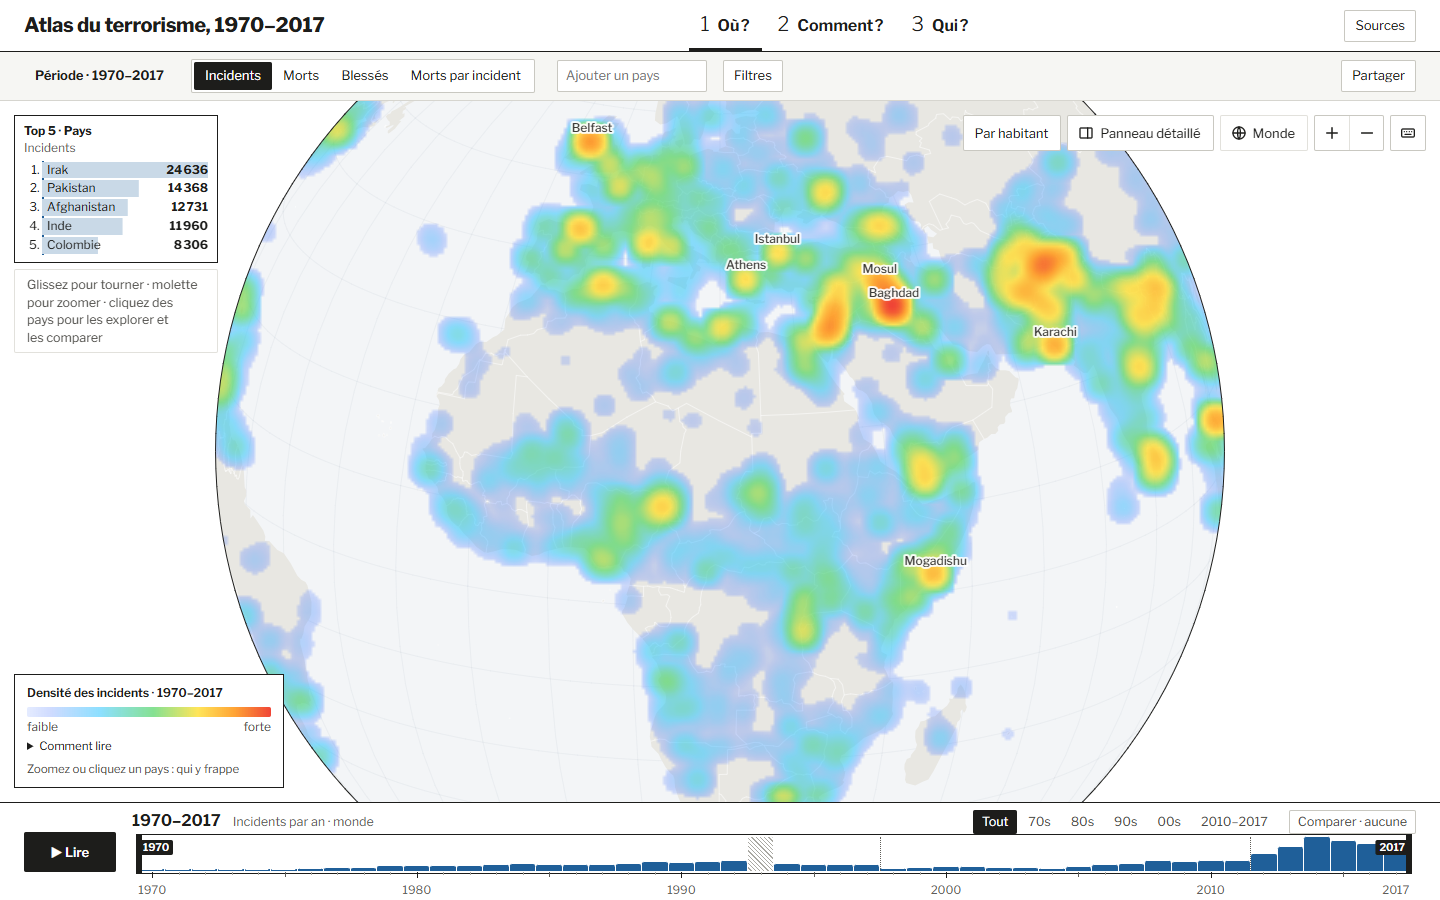
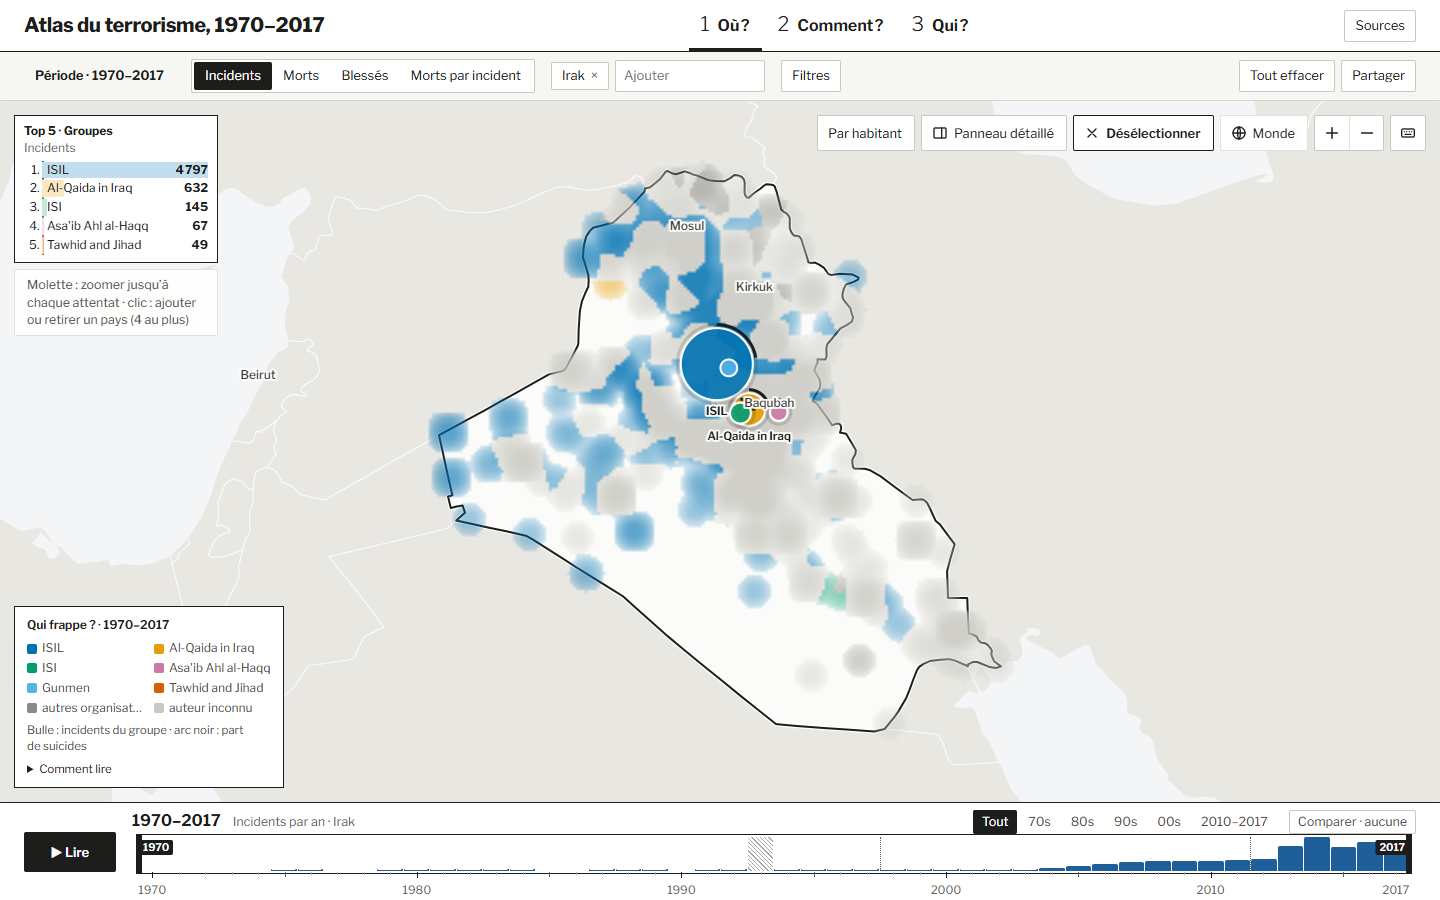
A heatmap reveals concentrations at world scale. Zooming brings locally dominant groups into view, then individual incidents when symbols can be distinguished. A top-five ranking and a detail panel provide the values needed for comparison.
How?
Connect the categories.
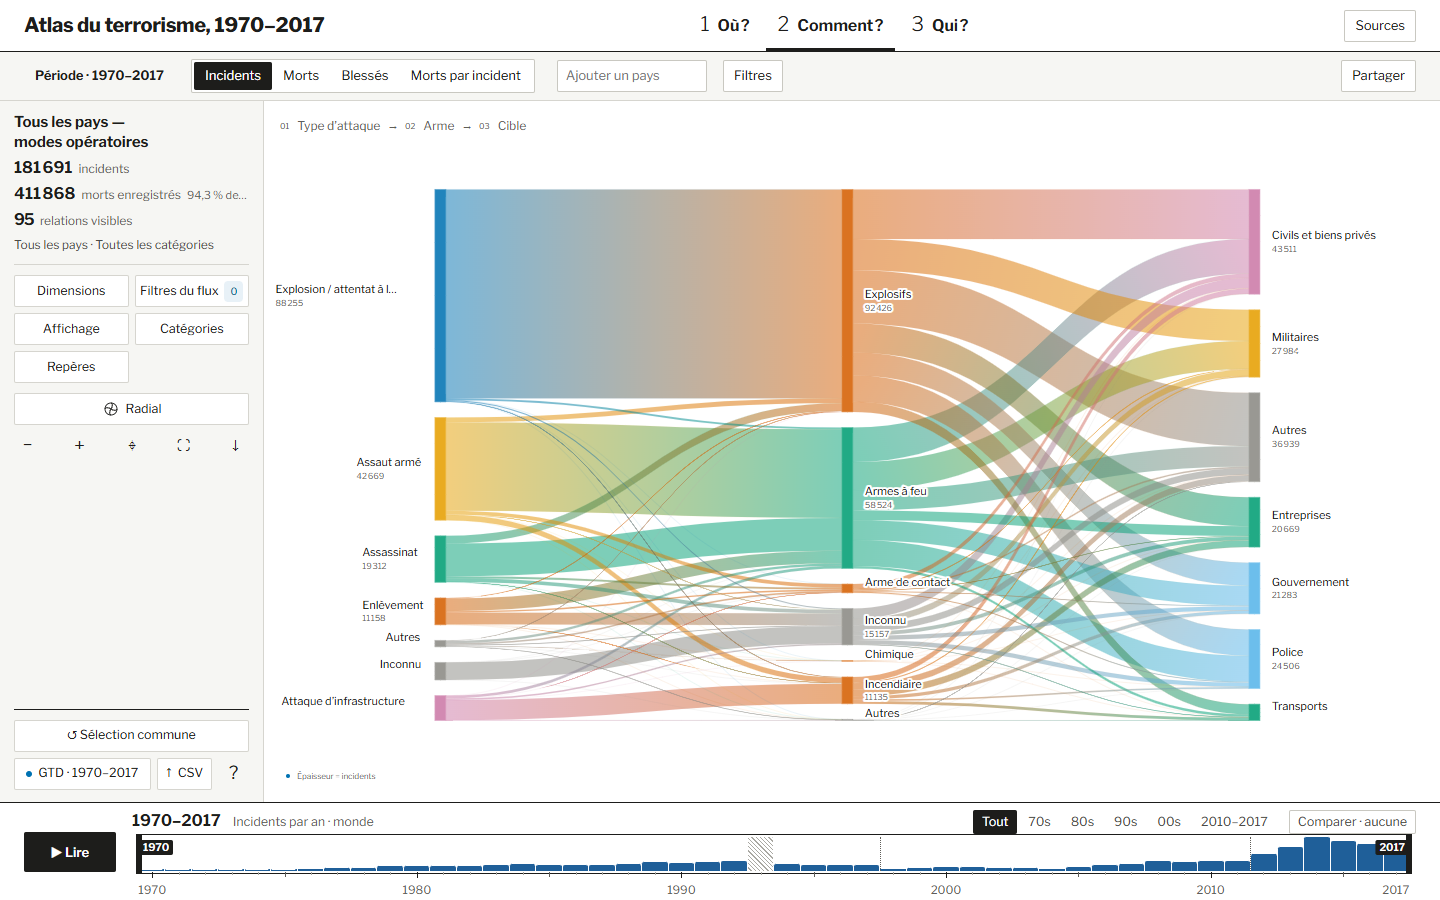
A Sankey diagram connects attack types, weapons and targets. Ribbon width encodes association weights between neighbouring axes. Filters and grouping of less frequent categories help examine a profile while keeping the diagram readable.
Who?
Follow changes in rank.
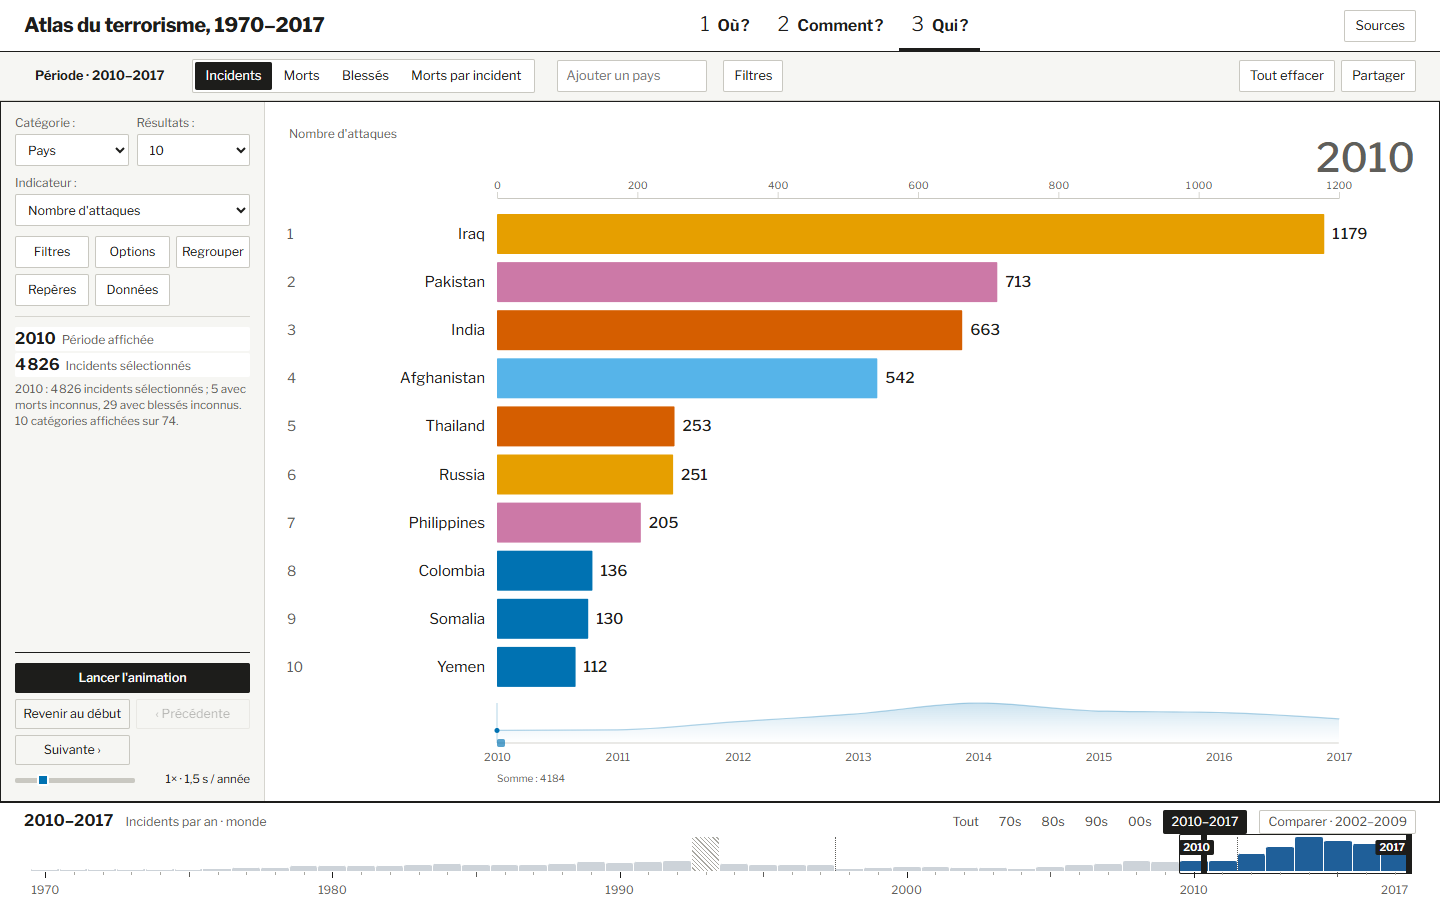
An animated ranking compares countries, groups or other categories using bars aligned to a shared origin. Playback, pause, speed and the timeline help readers follow changes and then verify a value at a specific date.
Prepare once, explore on demand.
The browser uses prepared files. Python preprocessing harmonises dimensions and preserves information needed to interpret missing values correctly.
Prepare
Read the CSV, harmonise country identifiers and generate aggregate, incident and summary JSON files.
Validate
Check data contracts when loading files through shared types and validators.
Coordinate
Share an immutable store for period, metric, countries and filters. Preserve the context in the URL.
Represent
Mount independent D3 modules, load details on demand and clean up subscriptions when switching views.
TypeScript and Vite structure the application. D3, D3 Sankey and TopoJSON support its representations. A shared core provides the store, contracts and time series. Prefix sums speed up calculations over time windows, while lazy loading avoids fetching every country’s details at startup. Tests cover data, series, state, geometry and module boundaries.
Make the meaning visible.
Encoding choices and denominators change how a visualisation reads. The project makes those choices explicit rather than reducing every question to a total.
- Separate missing and zero
- 1993 has no data in this extract. Unknown casualty figures remain unknown and are not converted to zero.
- Keep coverage visible
- 4,558 incidents have no coordinates. They may contribute to totals without appearing on the map. Spatial density and national totals cover different records.
- Read measures in context
- Averages use incidents with known casualty figures. Collection changes and unknown categories should accompany comparisons across time.
The data behind the views.
Source: START, University of Maryland (2018), Global Terrorism Database. Incident counts, period and missing-data details shown here refer to the local extract’s metadata.
Screenshots show the project’s application. This page documents its design and interactions; the explorer opens on a dedicated subdomain. The public repository may differ from the local version inspected.